Every year, the Environmental Protection Agency (EPA) releases funding to bolster and support the nation’s water systems to states, via the Clean Water State Revolving Loan Fund (CWSRF) and the Drinking Water State Revolving Loan Fund (DWSRF). The Infrastructure Investment and Jobs Act (IIJA) boosted these funds considerably, dedicating an additional $12.7 billion to the CWSRF and $30.7 billion to the DWSRF, including $15 billion designated for Lead Service Line Replacement and $5 billion for Emerging Contaminants between fiscal years 2022-2026.
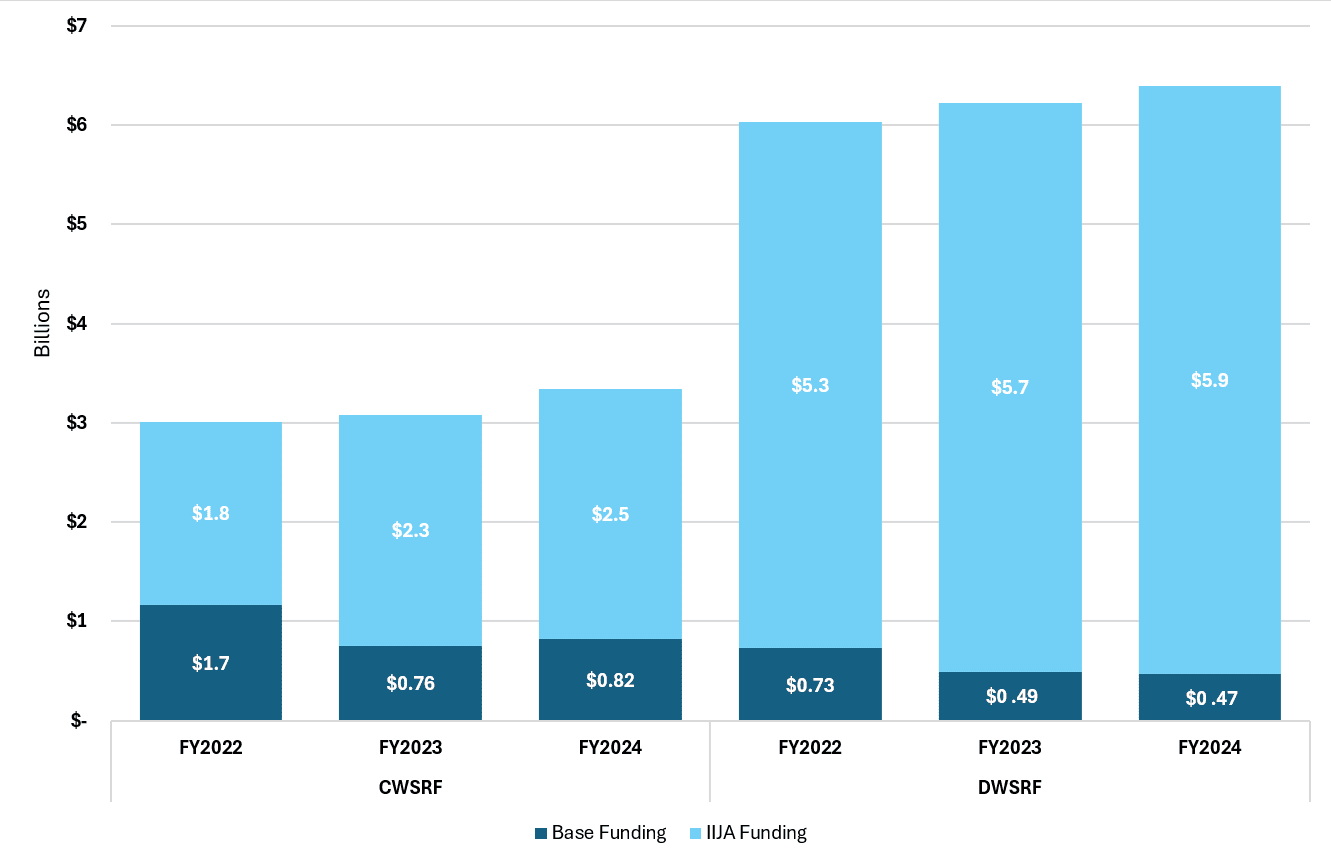
Figure 1: CWSRF and DWSRF funds available to states and territories, FY2022-2024

Source: Water Program Portal, Opportunities Dashboard and Environmental Protection Agency
Since IIJA’s passage in November 2021, base allocations for both state revolving funds (SRFs) have decreased — the CWSRF base by about 32 percent (around $380 million) and the DWSRF base by about 36 percent (around $26 million) between fiscal years 2022 and 2024. Simultaneously, CWSRF funding from IIJA has increased 28 percent (around $700 million) while DWSRF funding from IIJA has increased 10 percent (around $600 million); these increases are embedded in the SRF’s designs, and funding is projected to level out in FY2024, FY2025, and FY2026.
State-by-state allocations are determined on an annual basis, and generally shift due to demonstrated need (Figures 2 and 3).
Figure 2: Percent Change in CWSRF Funding, State by State, FY2023-2024
Between fiscal years 2023 and 2024, the bulk of states and territories saw an increase in funding of about 7 percent. Two states, Missouri and Nebraska, saw decreases in federal funding for the CWSRF Supplemental and CWSRF Emerging Contaminants funds, of 73 and 67 percent, respectively.
Those decreases were likely made in response to greater demonstrated need in Montana, North Carolina, and North Dakota; Montana experienced a 463 percent increase in funding — with almost six times more received in FY2024 — while both North Carolina and North Dakota received 156 percent increases — approximately three times more funding received in FY2024 — all of which occurred within CWSRF supplemental funding.
IIJA’s text reserves 49 percent of SRF funding and 100 percent of Emerging Contaminants funding to be dispensed as principal forgiveness loans pointed toward disadvantaged communities (DACs). 49 percent of the DWSRF’s Lead Service Line Replacement funding is also earmarked for DACs.
State-by-state allocations for the CWSRF are statutorily determined by the Clean Water Act. The landmark legislation has formulas that are run annually for each of the SRF’s funding streams. These formulas have been altered over time, largely in response to biennial needs surveys performed by EPA, and hinge on three variables: total needs, partial needs, and population factors. Historically, EPA has reported that the needs survey underestimates water quality needs, mostly due to underreporting by states for activities such as stormwater management and wastewater treatment. As such, in EPA’s 2016 CWSRF allotment report, water quality impairment data was added to counterbalance the reporting gap.
State DWSRF Allocations between fiscal years 2023 and 2024 are more varied (Figure 3). Again, these allocations were determined based on the latest needs assessment conducted by the EPA.
Figure 3: Percent Change in DWSRF Funding, State by State, FY2023-2024
Most states and territories received increases in funding of around three to five percent. Several states experienced decreases in funding, ranging from Tennessee’s one percent decrease and the U.S. Virgin Islands’ 45 percent decrease. The outliers in this crop are Minnesota and New Mexico, experiencing funding increases of 63 percent and 86 percent respectively.
State allocations for the DWSRF are statutorily outlined in the Safe Drinking Water Act. The 7th Drinking Water Infrastructure Needs Survey’s results were released in September 2023. It heavily factored into reallocations for DWSRF Lead Service Line Replacement funding this fiscal year and FY2023, as it provided new estimates on the amount and distribution of lead service lines nationwide, driving some of the resulting variation in funding.
All in all, the SRFs are allocating almost $10 billion this year. State and territories’ agencies independently manage distribution of CWSRF and DWSRF funding. Next up, states and territories will be preparing their Intended Use Plans (IUPs), which the EPA will review and approve before distributing funding to state agencies. Finally, projects included in the priority project lists — submitted alongside the IUPs — can begin their work.


