As the nation’s water infrastructure ages and new problems emerge, funding is required to maintain, upgrade, and expand our water system. The passage of the Infrastructure Investment and Jobs Act (IIJA) in August 2021 committed significant funds to that end, including a substantial boost in funding the Clean Water State Revolving Fund (CWSRF) and the Drinking Water State Revolving Fund (DWSRF). These two funds serve as cornerstone funding levers for the nation’s drinking water and wastewater water infrastructure, disseminating federal funds on an annual basis to state agencies, which implement the funding to support water infrastructure projects. As its name suggests, the DWSRF is aimed at projects improving drinking water treatment, water distribution, and water supply. The CWSRF focuses on wastewater systems and funds eleven types of projects, including those of water conservation, efficiency and reuse, technical assistance, and ecological projects like protecting estuaries, watersheds, and stormwater treatment.
IIJA directed an additional $43.4 billion in funding for the DWSRF and CWSRF through 2026. So far, has been distributed to states for local implementation, or 57 percent of what was appropriated by IIJA. This spotlight will focus on CWSRF projects supported by IIJA. For a summary of all SRF investments to date, check out the Water Program Portal’s annual report, “A Review of Federal Water Investments,” and for a deep dive into SRF funding for lead service line replacements check out our past Spotlight on the topic.
Of the billions made available for the SRFs by IIJA, the Environmental Protection Agency (EPA) is providing $11.7 billion for general CWSRF projects, and an additional $1 billion for emerging contaminants. This has doubled overall funding for CWSRF projects for the past three years (Figure 1).
Figure 1: Funding for Clean Water State Revolving Loan Funds, FY2022-24
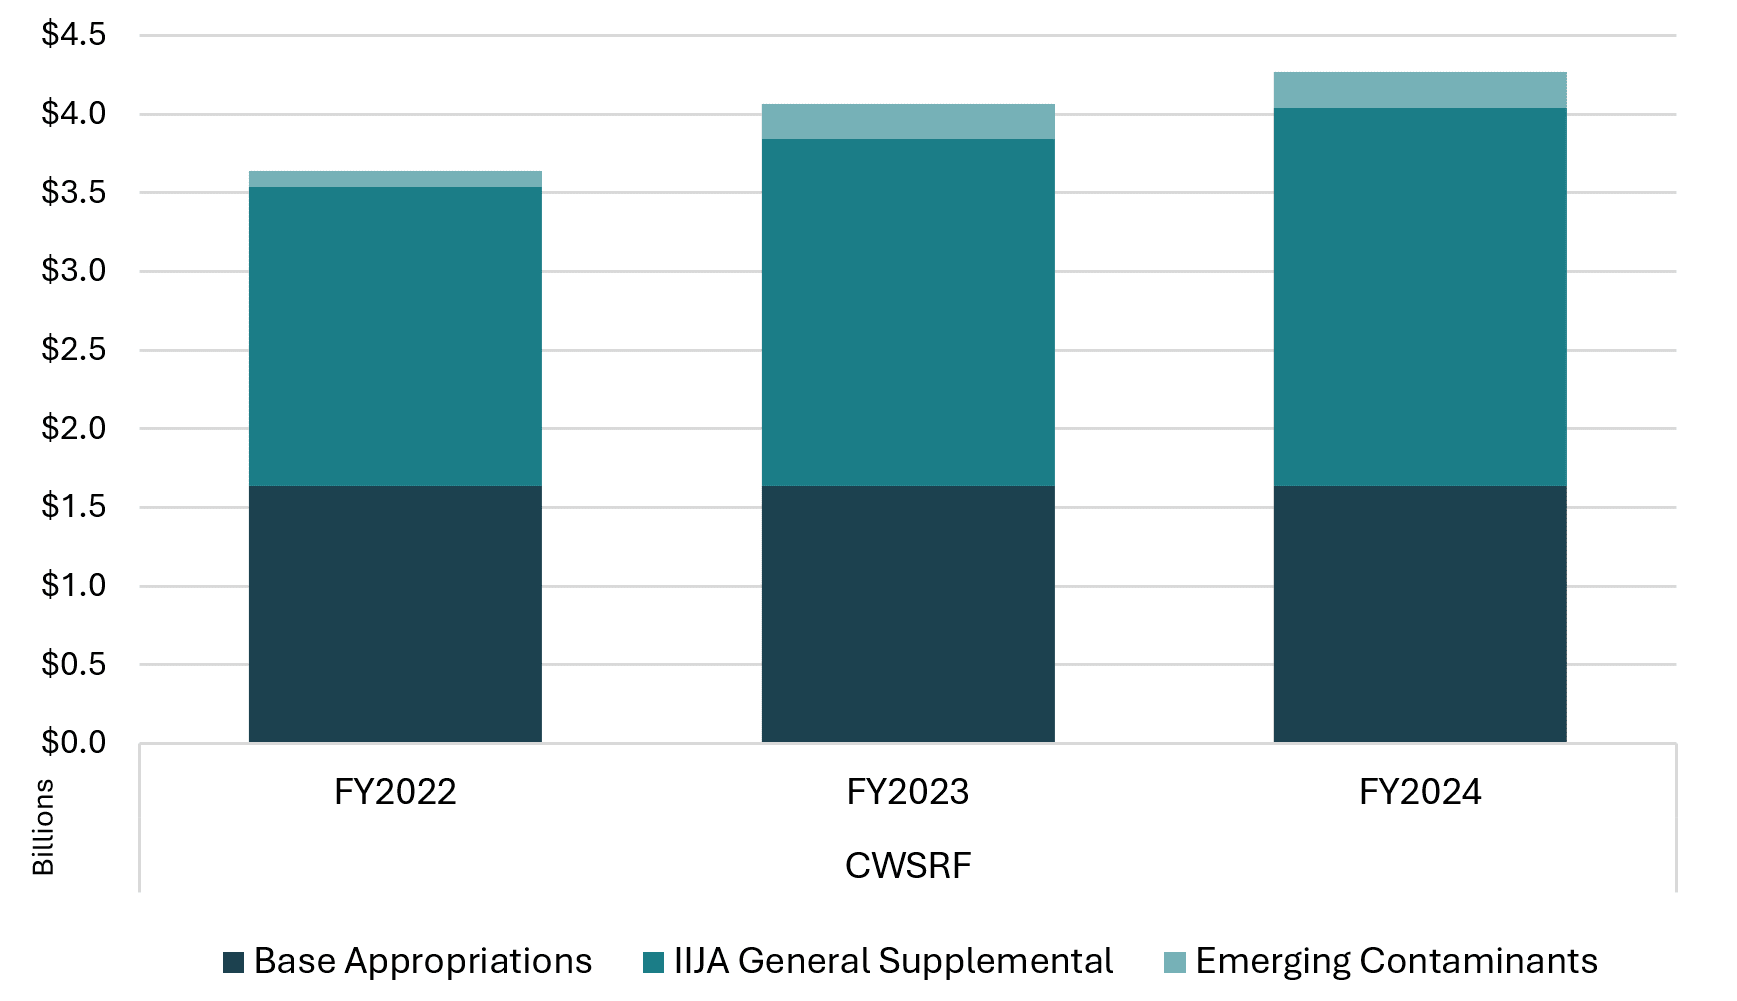
Base Appropriations refers to the funding provided to the SRFs by general, non-IIJA appropriations. IIJA General Supplemental, Emerging, Contaminants, and Lead Service Lines all refer to the various SRF funding streams appropriated by IIJA. Total funding by federal fiscal year includes DWSRF and CWSRF funding.
Source: Atlas Public Policy Water Program Portal Annual DWSRF and CWSRF Allocations.
SRF funds are allocated to states annually based on EPA’s Needs Survey and Assessment data and distributed to state agencies once they submit their intended use plans. Once EPA announces annual SRF allocations for each state, the state agencies responsible for implementing those funds publish Intended Use Plans with priority project lists. After these are submitted to EPA, funds are officially awarded to states, who in turn support local projects via competitive grant process. Given this process, it can take longer for projects to be funded via the SRFs than a direct federal grant. Consequently, funding from the last three years is at various stages of implementation.
Almost all FY2022 allocations and most FY2023 allocations have been awarded to states (Figure 2). For some states, CWSRF funding has not yet been awarded, partially awarded, or has been transferred (often a state opting to transfer their CWSRF Emerging Contaminants funding to their DWSRF or vice versa, so the funds can be implemented in one program). Some states have formally declined or only applied for part of their funds. In FY2022, Alaska, Hawaii, South Dakota, and Washington only accepted part of their DWSRF lead service line (LSL) funding. In the same year, Oklahoma also declined part of its DWSRF Emerging Contaminants funding. In FY2023, Arizona, Maine, Oregon, and Washington, also only accepted part of their DWSRF LSL funding, while states like Alaska, Montana, South Dakota, and Wyoming declined it all. In FY2023, Mississippi, Tennessee, and Wyoming also declined funding for emerging contaminants.
Figure 2: Percentage Implementation Status of CWSRF Funding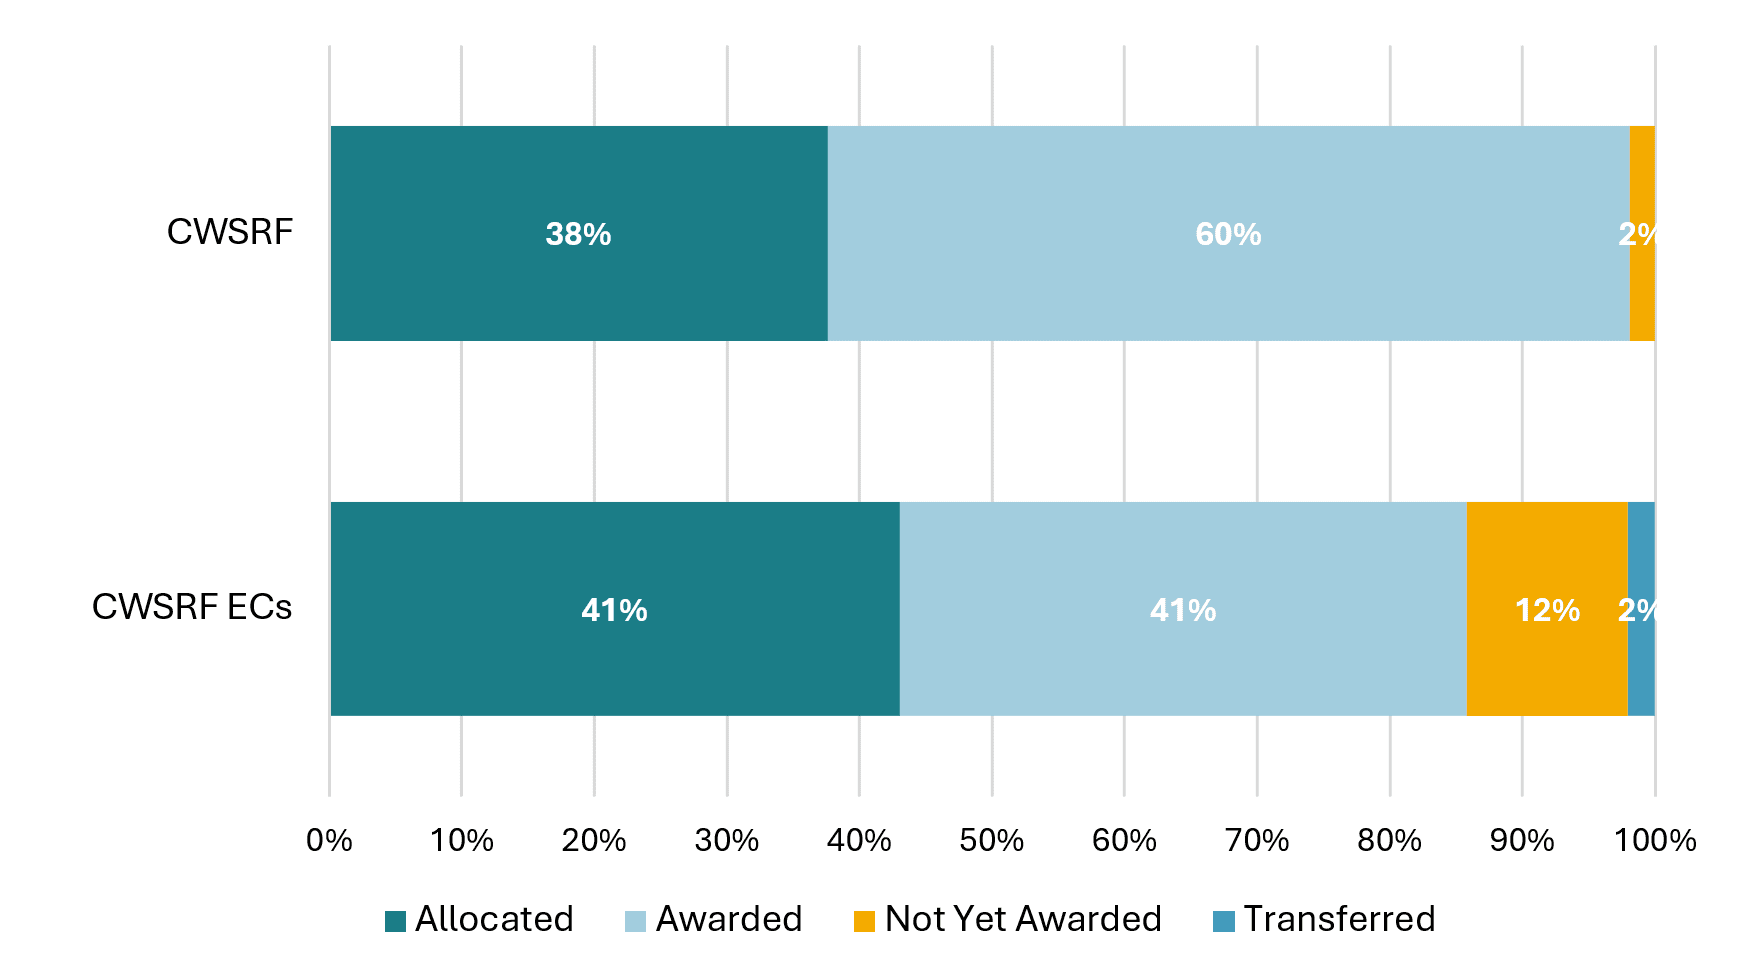
CWSRF ECs refers to the CWSRF Emerging Contaminants program. Allocated refers to FY2024 SRF funds that have been allocated to states but have not yet been awarded. Not Yet Awarded refers to FY2022 and FY2023 allocations that have yet to be awarded to states. Transferred refers to cases where a state decides to transfer funds for one sub-SRF program to another (particularly, transfers from CWSRF Emerging Contaminants funding to their DWSRF, combining all Emerging Contaminants funding). Funding that has been declined is not included in this figure, as it has not been awarded to state programs.
Source: Atlas Public Policy Water Program Portal Outcomes Dashboard, Environmental Protection Agency Bipartisan Infrastructure Law SRF Funding Status.
To date, EPA has released data on projects through FY2022, the first year of the IIJA funding boost. According to the EPA, around $2.2 billion has gone to SRF projects, with about half supporting clean water and drinking water, respectively. This first release of project data represents about 30 percent of the funding awarded to states. This is in part due to some states not yet reporting their data to the EPA and in part due to states not yet implementing FY2023 awarded funds. This dataset is likely to grow over time. For now, it provides an early snapshot as to where funding is going.
Across the board, most CWSRF general funding and supplemental IIJA funding supported centralized wastewater treatment activities, including secondary treatment, advanced treatment sewer system rehabilitation, combined sewer overflows (CSO) correction, infiltration or inflow correction, new interceptors, and new collector sewers. Beyond wastewater treatment improvements, many funded projects also included work related to water and energy conservation, stormwater management, and habitat restoration. After the seven treatment-focused project categories, the next most funded types of projects in the general CWSRF pool were water reuse, gray stormwater management infrastructure, and nonpoint source water pollution reduction (Figure 3). Regarding stormwater management projects, most funding (71 percent or $735 million) continues to support grey infrastructure; however, about $295 million of general CWSRF funding has supported green infrastructure (Figure 3).
Figure 3: CWSRF Project Categories (General Funding)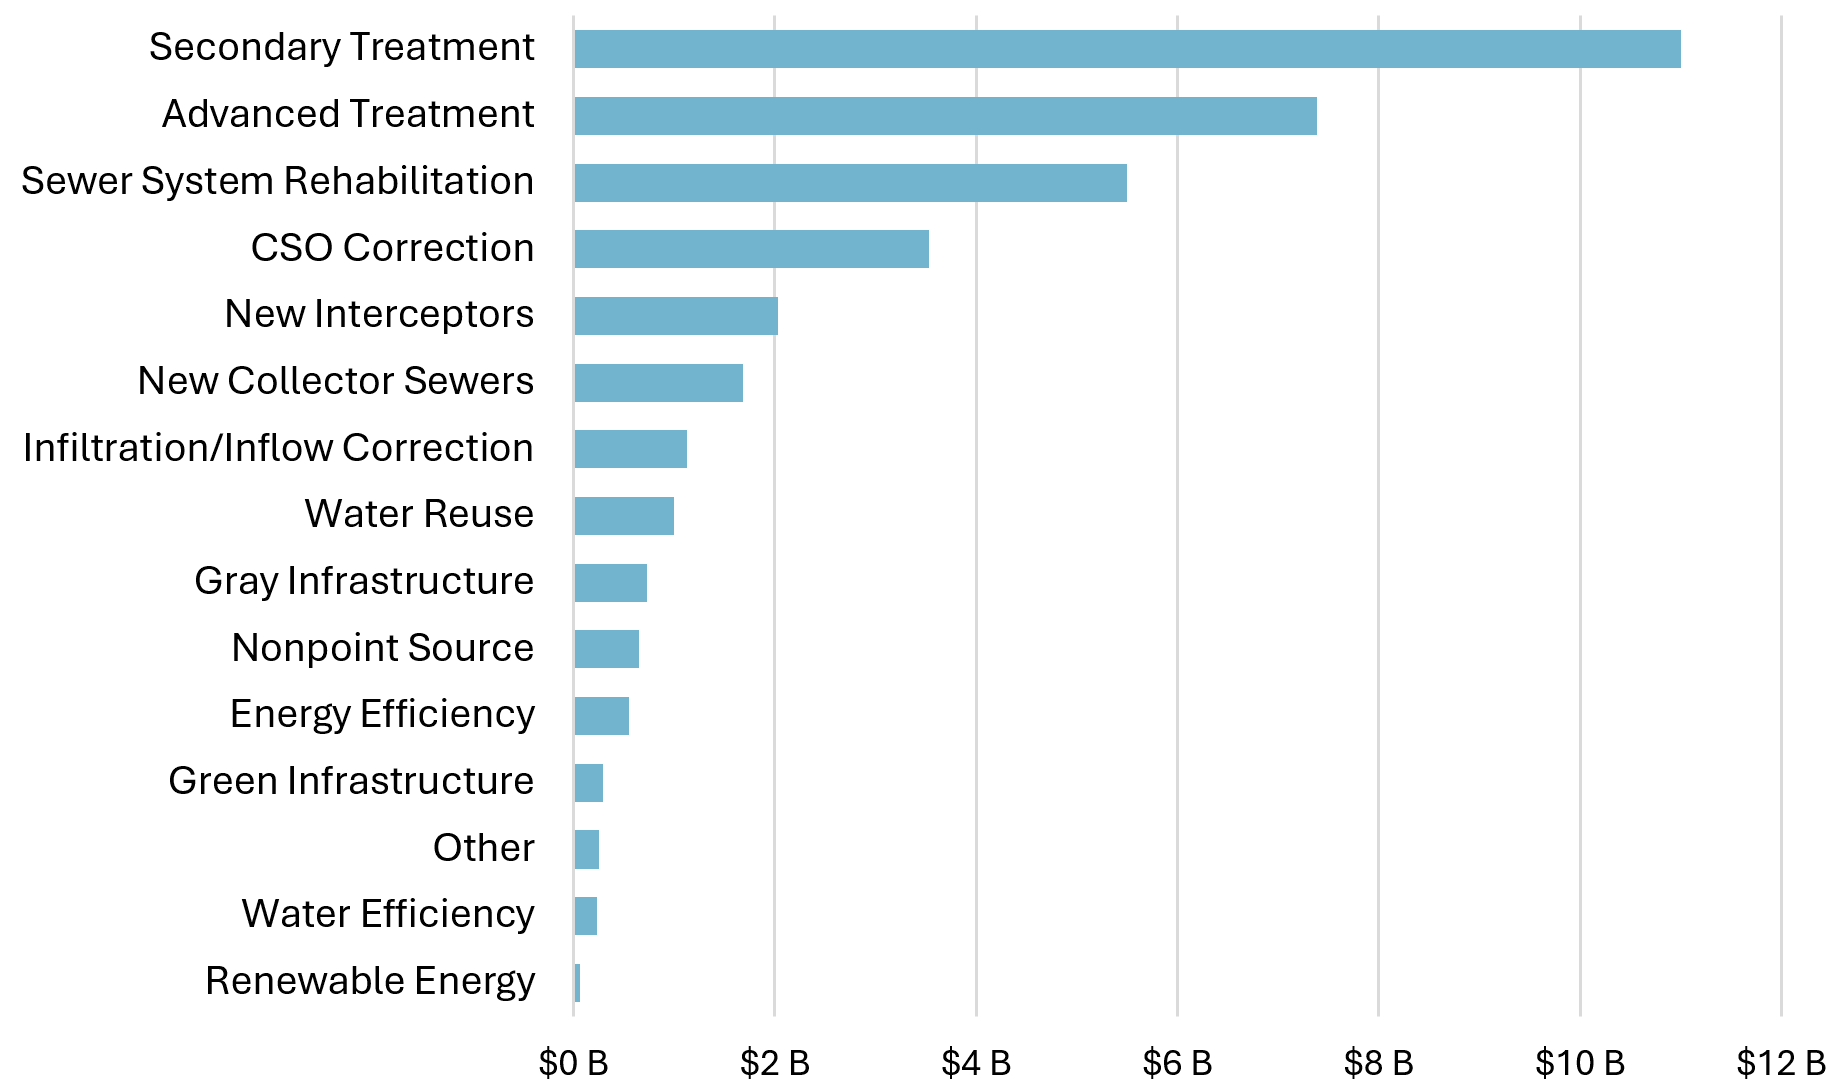
For the purposes of this figure, all spending on Nonpoint Source and Other sub-categories has been condensed. To view the disaggregated data, visit the Water Program Portal. New Interceptors IIJA funding amounts to $583,008.42 and Green Infrastructure funding amounts to $229,200.
Source: Atlas Public Policy Water Program Portal State Revolving Fund Project Dashboard, 2024.
Projects funded by IIJA supplemental funding show a similar pattern. After wastewater treatment, funding also supported energy efficiency, nonpoint source water pollution reduction, and gray stormwater management infrastructure (Figure 4). A much higher share of the supplemental IIJA funding for stormwater management supported gray infrastructure over green infrastructure (roughly 97 percent), but the Water Program Portal will continue to monitor this as more data is released by the EPA.
Figure 4: CWSRF Project Categories (IIJA Funding)
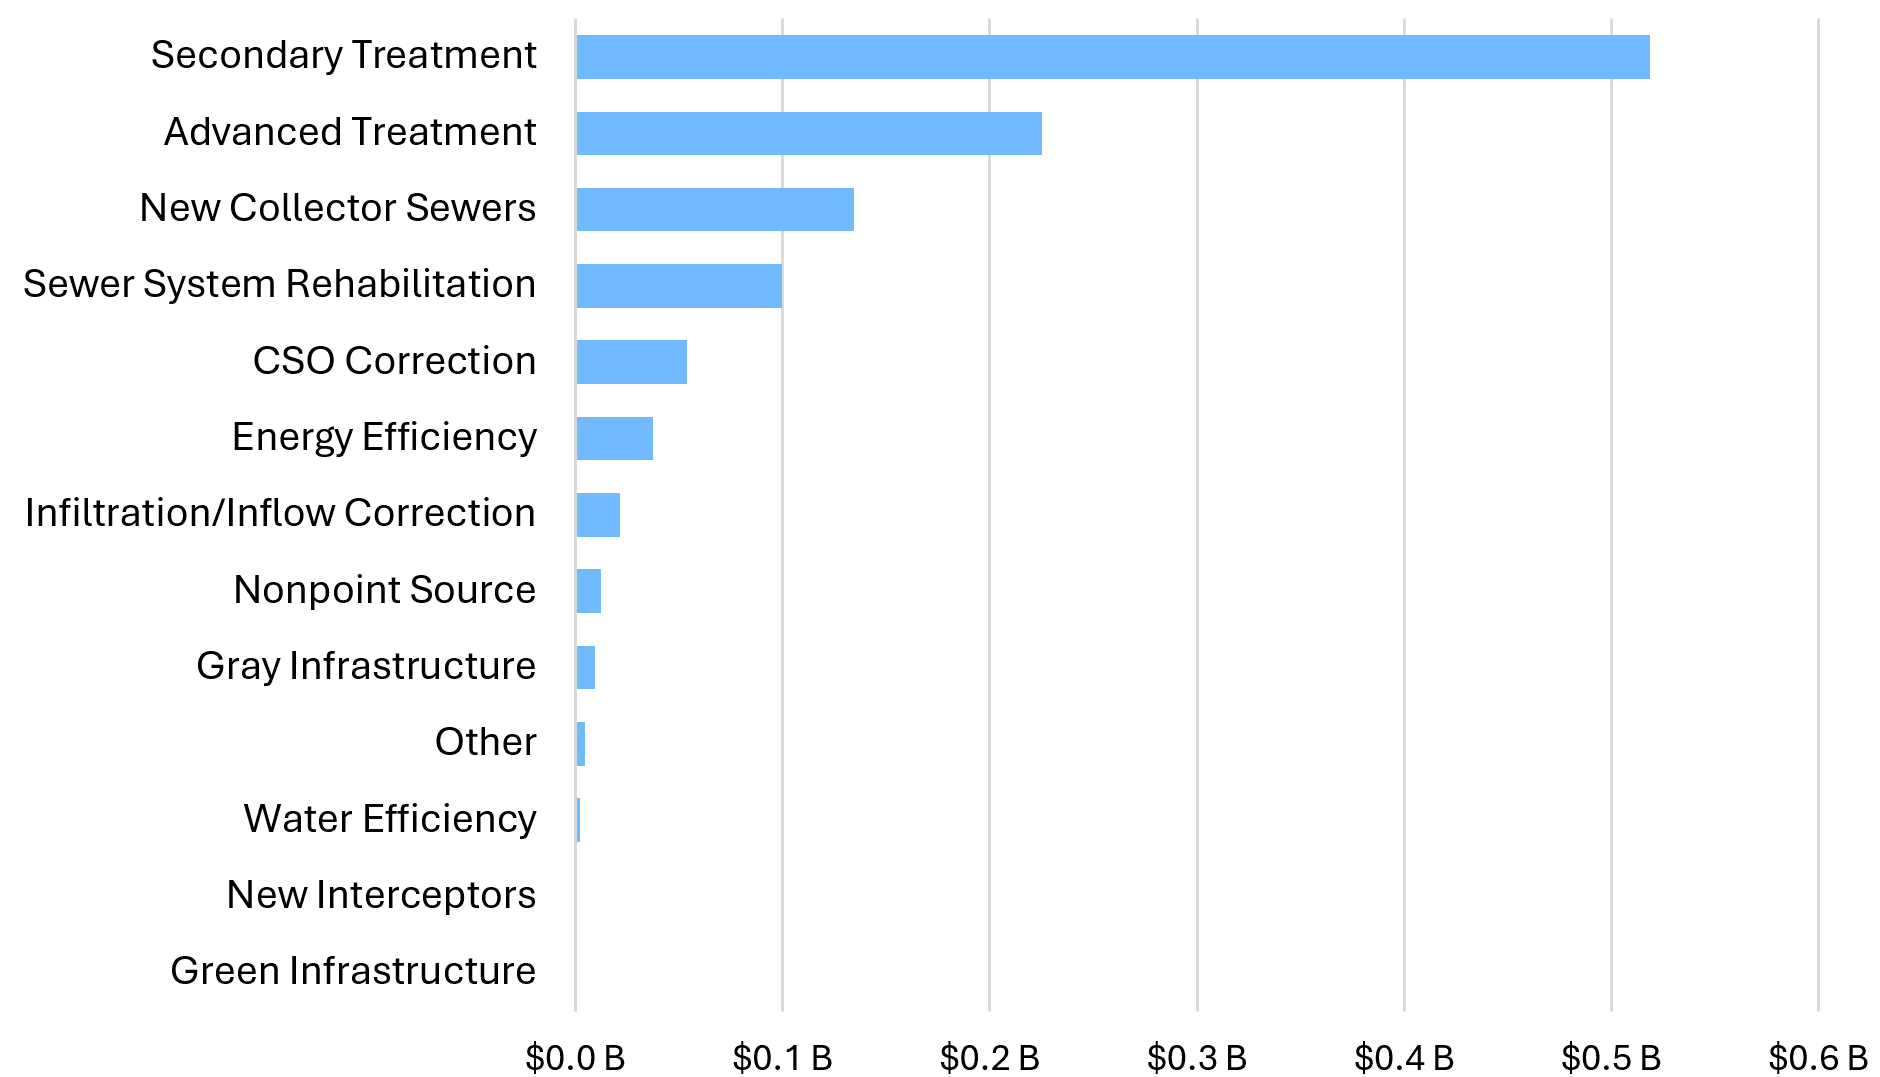
For the purposes of this figure, all spending on Nonpoint Source and Other sub-categories has been condensed. To view the disaggregated data, visit the Water Program Portal. New Interceptors IIJA funding amounts to $583,008.42 and Green Infrastructure funding amounts to $229,200.
Source: Atlas Public Policy Water Program Portal State Revolving Fund Project Dashboard, 2024.
IIJA-funded CWSRF projects are more likely to be in disadvantaged communities (DACs). On average, about three-quarters of IIJA-funded projects are serving DACs, significantly more than the roughly 27 percent of all CWSRF projects (Figure 5). This suggests that state CWSRFs have been more intentional about directing their IIJA funding “boost” into historically underserved communities.
Figure 5: Percentage of CWSRF Funding Sited in DACs

Source: Atlas Public Policy Water Program Portal State Revolving Fund Project Dashboard, 2024.
Overall, about 29 percent of all green infrastructure projects were in a DAC. There is insufficient data to assess whether IIJA-supported green infrastructure projects are breaking from that trend. So far, the only IIJA-supported green infrastructure project is in a DAC, suggesting that though these types of projects have been supported by IIJA supplemental funding less than the general funding pot, when they do happen, they have been in disadvantaged communities. As project data supported by 2023 and 2024 funding is released, we will be better able to make insights as to whether IIJA funding is increasing green infrastructure and whether these new green infrastructure projects are serving disadvantaged communities.
To explore the CWSRF project data, alongside the DWSRF project data, check out the Water Program Portal’s new IIJA State Revolving Fund Project Dashboard. Look out for updates in 2025 as more data is released.
