The Water Program Portal’s Opportunities Dashboard tracks federal investments in our water systems, ranging from programs focused on infrastructure to agriculture to climate resilience. Currently, the Portal tracks $151 billion in funding from 153 programs, as well as open requests for proposals, requests for information, and public comment periods for these programs. But what happens to this money once it’s allocated? Where are water-based projects happening? How are formula programs’ funding being distributed?
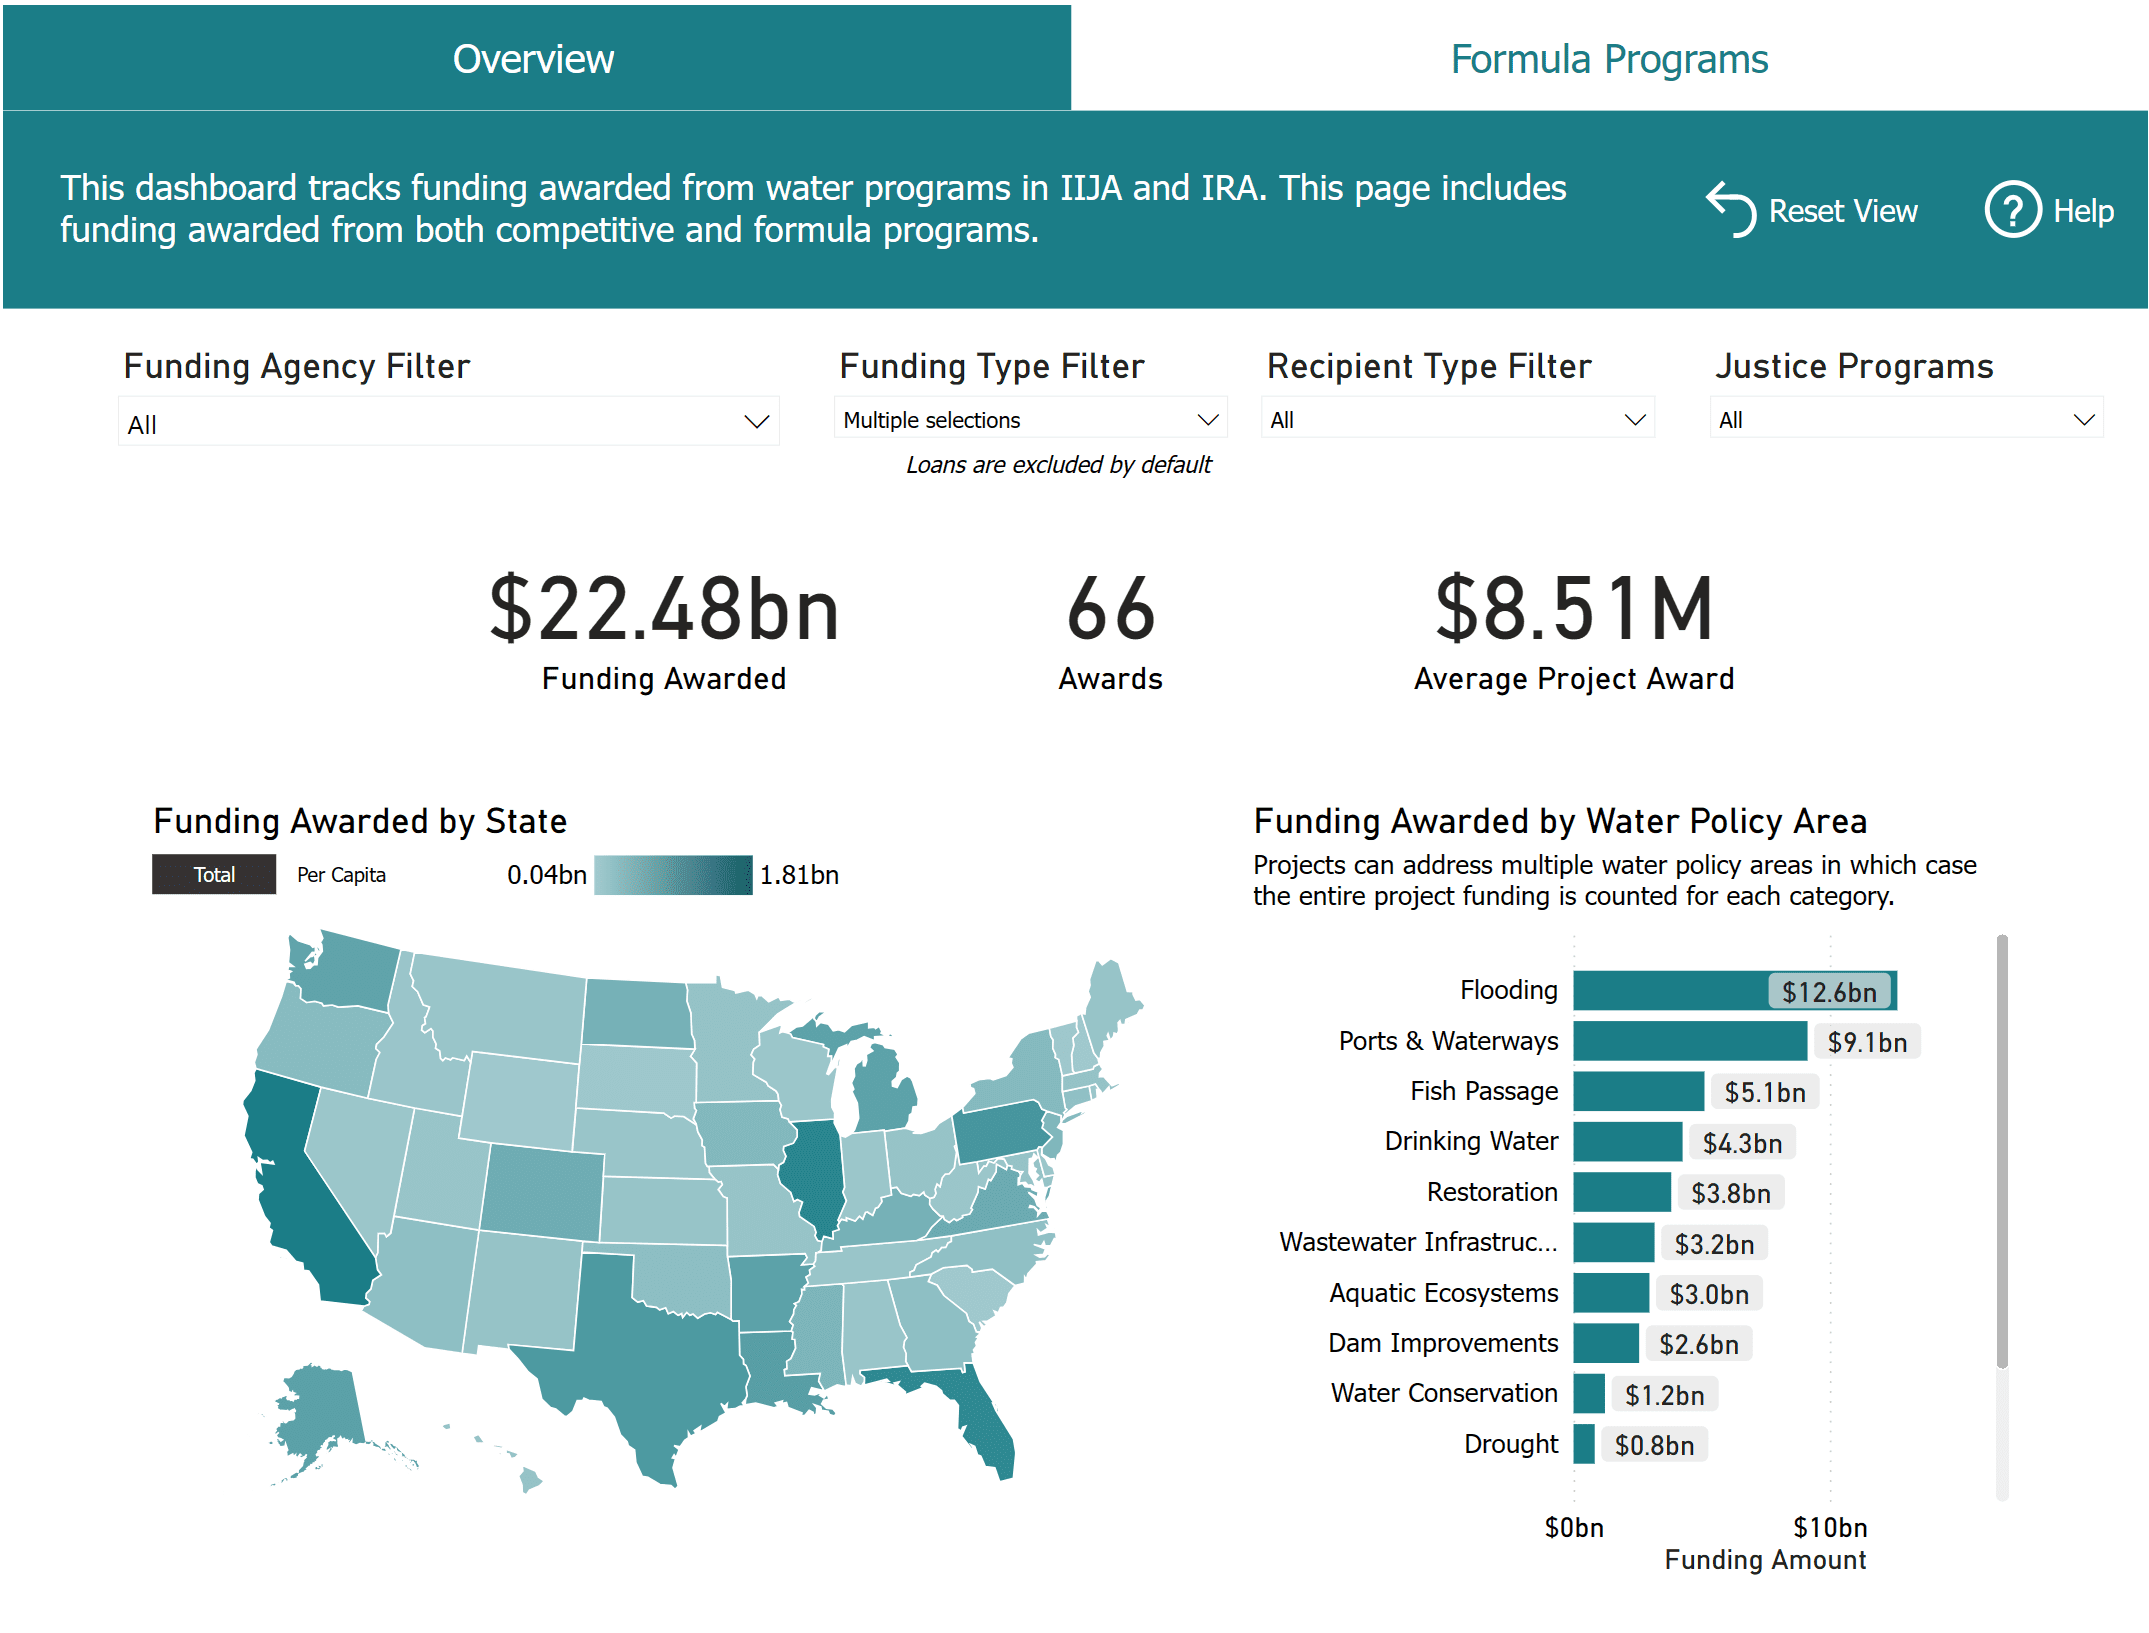
We aim to answer these questions and more on our new tool, the Outcomes Dashboard. Launching December 6th, the new dashboard will highlight categorical information such as how much funding each state has been awarded, how much each program has been awarded, and funding awarded by water policy area and recipient type. Users will also be able to view specific award announcements by date, program, and funding amount; the same analysis is available for projects.
Like the Opportunities Dashboard, the Outcomes Dashboard will be continuously maintained in order to provide the most up-to-date information on federal awards and project funding in the water world. Here are some high-level data points that will be displayed on the dashboard:
- Of the $151 billion surface on the Opportunities Dashboard, the Outcomes Dashboard indicates that 15 percent ($22.5 billion) has been awarded, 15 percent ($23 billion) has been allocated, and 5 percent ($7.7 billion) is available as of now. This means that about two-thirds of IIJA and IRA funding ($97.5 billion) has yet to be tapped.
- The five states that have received the most funding are California ($1.81 billion for 358 projects), Illinois ($1.60 billion for 43 projects), Florida ($1.53 billion for 53 projects), Pennsylvania ($1.23 billion for 60 projects), and Texas ($1.15 billion for 109 projects). Altogether, the top five funded states represent almost a third (32.6 percent) of total funding awarded thus far.
- The most funded policy areas are Flooding ($12.64 billion) and Ports & Waterways ($9.13 billion); these sorts of projects are funded significantly more than the next-largest policy area, Fish Passage ($5.11 billion). About half of Ports & Waterways funding has been awarded by the Local and Regional Project Assistance Grants (RAISE) at $4.51 billion.
- Justice40 programs comprise 32 total awards, totaling $10.88 billion and representing about 48 percent of total awarded funding. Florida has received a dominant plurality of J40-based funding, at 12.52 percent of total J40 funding ($1.36 billion for 25 projects). California has received the second-most amount of J40-qualified funding at 7.91 percent ($859.7 million); this amount is funding 173 projects, the nationwide by a long shot and 7 times more than Florida.
- The formula programs being tracked by the Outcomes Dashboard are: all of the Drinking Water State Revolving Funds, All of the Clean Water State Revolving Funds, the Water Infrastructure Improvements for the Nation, Small and Underserved Communities Emerging Contaminants Grant Program, and the Promoting Resilient Operations for Transformative, Efficient, and Cost-Saving Transportation Formula Program. For each of these programs, state-by-state funding allocations are available. For the state revolving funds, links to federal fiscal year 2022 and 2023 Intended Use Plans are also available for states that have released them.
Learn more about the Water Program Portal’s Outcomes Dashboard, its features, and best practices for its usage at our tour and Q&A session on December 6th, 11-11:30 am PST. Register for the tour today.


